
This work is licensed under a Creative Commons Attribution 4.0 International License that allows sharing, adapting, and remixing.
The last test that we will cover is for comparing the frequencies of people in different categories. For example, a sociologist might be interested to see if the number of people in a particular demographic group are similar to or different from expectations. For our example we will compare the number of men and women enrolled in college. Are there equal or unequal numbers of men and women attending college? These data are sometimes called nominal scaled data because we are simply counting the number of people in a particular category.
The test that we need for comparing the frequencies of people in different categories is the chi-square test. This test compares the number of people (observed frequencies) to the number of people anticipated if everything was random (expected frequencies). This test is often used to answer the question about whether there are equal or unequal groups of people.
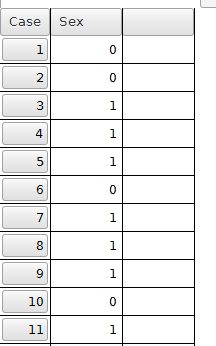
The data file will need to code the group membership. In this example we have sampled 20 college students. The sex of each student is recorded as a 0 (male) or 1 (female). Some of the data are shown below. The data file is available for downloading.
The chi-square goodness of fit test is available in PSPP through the Analyze, Non-parametric Statistics, chi-square command. The dialog box looks like this:
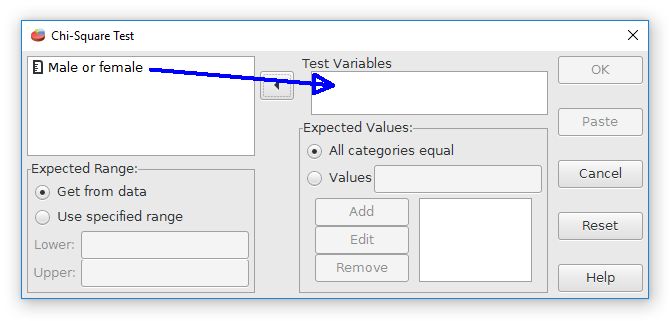
Move the variable for the group membership to the test variable field. For expected values, we will assume that each group has an equal number of people (50% males, 50% females) if everything is random. This is a null hypothesis prediction.
For some research questions it might be expected that the groups match a population value that is not exactly equal. The dialog box can be adjusted for these situations where a sample is expected to have a particular group size based upon pre-existing evidence.
Pressing the OK button will calculate the test results, which look like this:
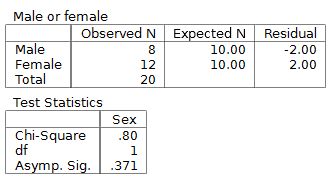
The results begin with descriptive statistics, which are a count of people in each category. The chi square test for this example is not statistically significant because the p value, shown as "Asymp. Sig." is p = .371.
In APA style, the proper reporting of chi-square test results is χ2 = (degrees of freedom, n = number of scores ) = chi-square score, p value. This example would be reported as χ2 (1, n = 20) = .80, p = .371.
Index | Next - Chi Square test of Independence
This work is licensed under a Creative Commons Attribution 4.0 International License that allows sharing, adapting, and remixing.