
This work is licensed under a Creative Commons Attribution 4.0 International License that allows sharing, adapting, and remixing.
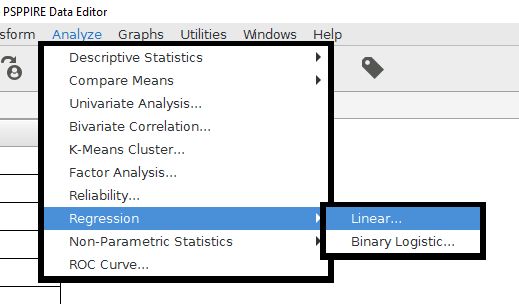
The last basic relationship analysis is simple linear regression. This is used to make predictions from an established linear relationship. The Linear Regression command is in the Regression folder of the Analyze menu.
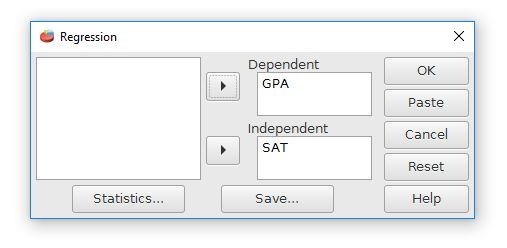
The Regression dialog box has fields for Independent (the X axis) and Dependent (the Y axis) variables. The variable used for making the predictions should be used for the X variable. We will be using SAT to make predictions about GPA. SAT is used for the X variable. College GPA will be our dependent or outcome variable that we are interested in making predictions about.
The "Statistics" button has some additional options for choosing the analyses.
The output file looks like this. Of particular importance are the "Unstandardized coefficients, B" column. This shows the weights for the regression formula.
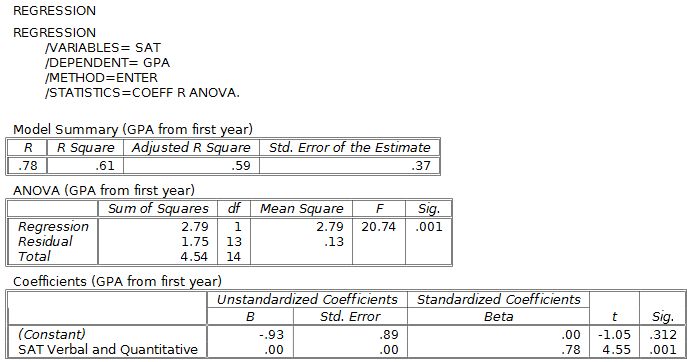
For this example, the slope is .0038 and the Y intercept is -.93, which can be expressed as the linear formula Y-prime = .0038X - .93. Base upon this, someone with an SAT score of 1000 would be predicted to have a GPA of 2.87.
Unfortunately, PSPP didn't display the third digit past the decimal point for the SAT variable in this example. It just displays .00.
Index | Next - Inferential statistics
This work is licensed under a Creative Commons Attribution 4.0 International License that allows sharing, adapting, and remixing.