
This work is licensed under a Creative Commons Attribution 4.0 International License that allows sharing, adapting, and remixing.
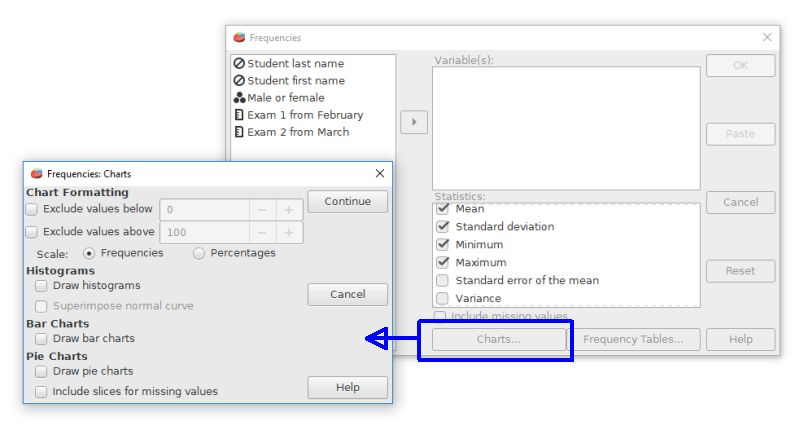
PSPP can make pie charts, histograms, and bar charts from the Frequencies command (Analyze > Descriptive Statistics > Frequencies). Click on the "charts" button of the Frequencies dialog box to select these options.
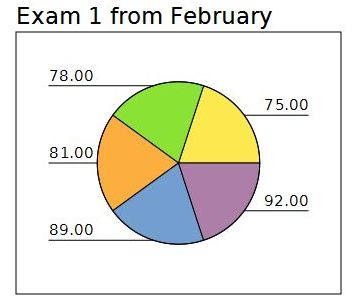
A basic pie chart from the Frequencies command will look like this:
Index | Next - Analyzing relationships
This work is licensed under a Creative Commons Attribution 4.0 International License that allows sharing, adapting, and remixing.