
This work is licensed under a Creative Commons Attribution 4.0 International License that allows sharing, adapting, and remixing.
The starting point for most statistical analyses is a description of the data. The aim is to summarize the data into a big-picture or bird's-eye view of what the typical participant is like. The next set of PSPP commands will focus on simple descriptive statistics such as measures of central tendency, variability, and graphs.
The critical difference between PSPP and spreadsheets is that PSPP does not use formulas in the cells of the data view. Data analysis with PSPP involves choosing the analyses from the drop-down Analyze menu. IBM, the maker of SPSS, has claimed that this approach is superior to spreadsheets because it eliminates the possibility of using incorrect formulas.
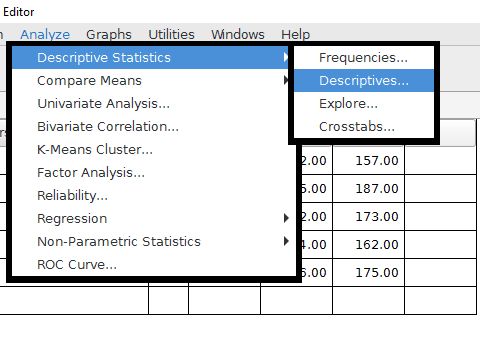
Most of the descriptive statistics that we will be using are located in the Descriptive Statistics folder of the Analyze drop-down menu. The basic process will be to choose the analysis, then select the variables and the details of the analysis in a dialog box. The results of the analysis will be displayed in the output window.
Index | Next - The Frequencies Command
This work is licensed under a Creative Commons Attribution 4.0 International License that allows sharing, adapting, and remixing.